top of page

Contents
Limits
Derivatives
Applications of Derivatives
Rates of Change


Average Rate of Change (Slope of a Secant Line): For any function y=f(x), the average rate of change over the interval [x1, x2] is calculated by Δy/Δx.


Secant Line: A line that intersects two or more points on a curve.
Tangent Line: A line that touches a curve at a point.

Instantaneous Rate of Change (Slope of the Tangent Line at a Fixed Value): The value that the average rate of change approaches as Δx approaches zero.
Limits

Limit: A single value that f(x) approaches as a given value of x is approached.

For certain functions, as an x value is approached, a limit does not exist.


Limit laws can simplify limit calculations.


The limits of rational functions and polynomials can be found by replacing x with c. Factoring may be required for certain rational functions that result in a denominator of zero when x is replaced with c.
Limits (Precise)


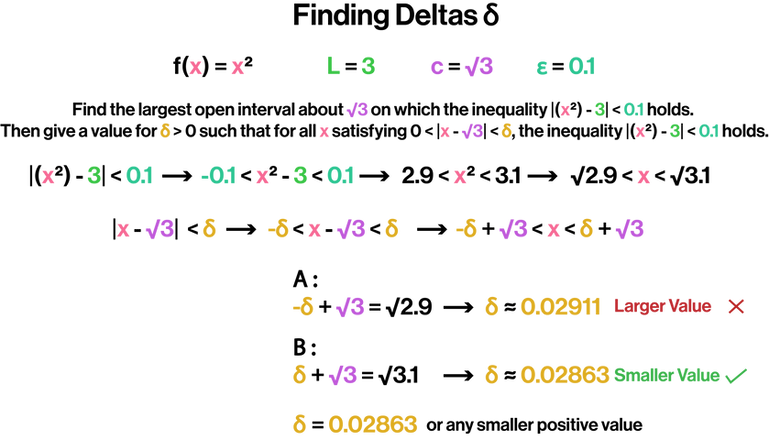

The precise definition of a limit involves the variables ε (epsilon) and δ (delta).
One-Sided Limits

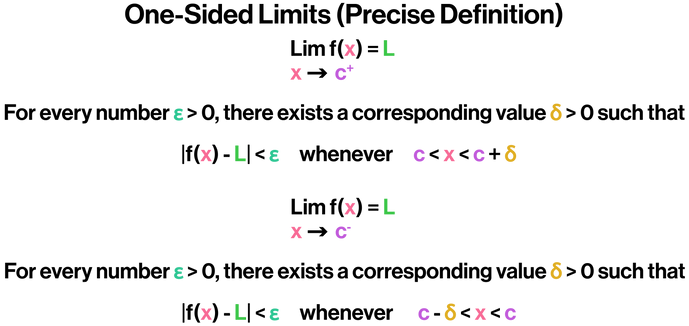

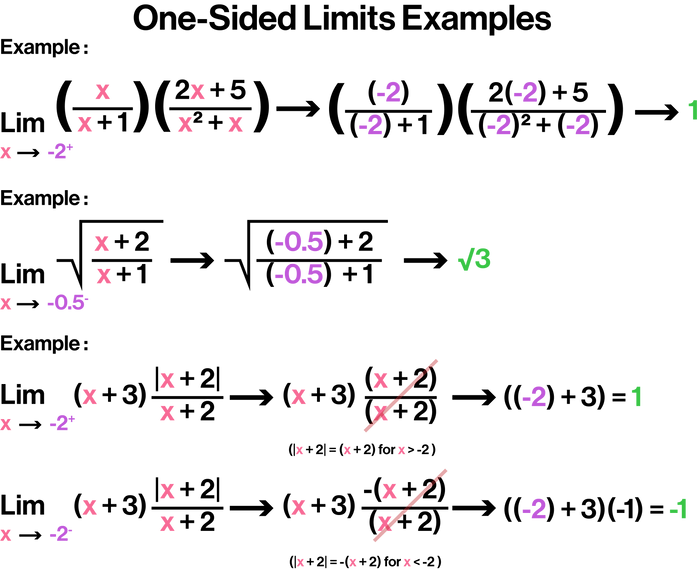
Limits can be one-sided.
Special Limit sin x / x

A special property applies to the limit of sin x / x as x → 0.
Continuity


Continuous Function: A function that is continuous at every point in its domain.
Discontinuous Function: A function that is discontinuous at one or more points.


Continuity Test: The criteria that a function must meet to be continuous.

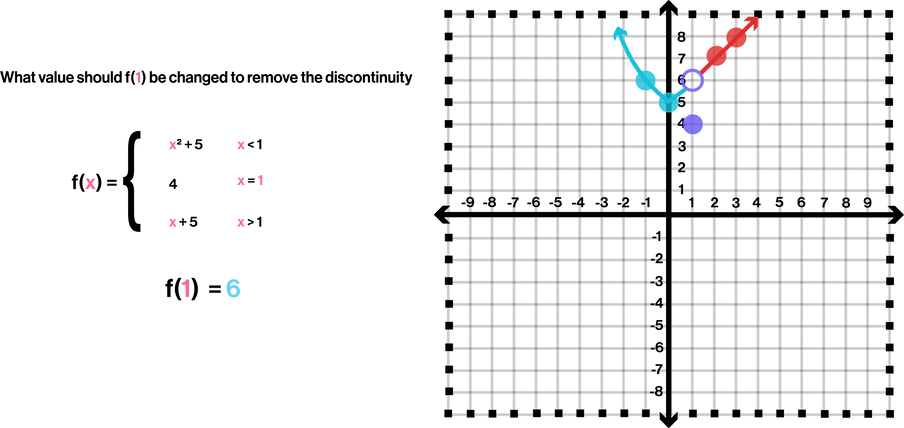
Removable Discontinuity: A point on a discontinuous function that can have its definition changed to make a new continuous function.
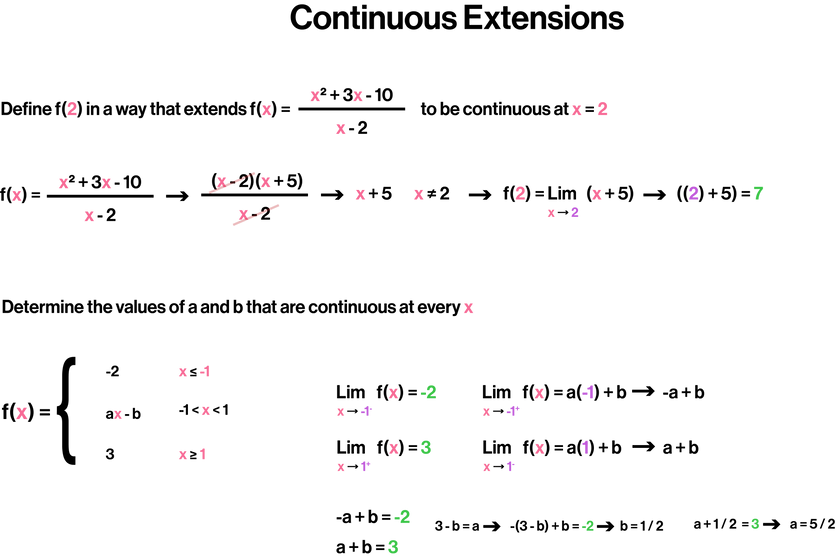
Extending the domain of f to include x = c. The extension creates a new function that is continuous at x = c.
Limits and Continuity (Trigonometric Functions)

Trigonometric functions may be involved in questions related to limits and continuity.
Limits (Infinity)


Limits can involve infinity.
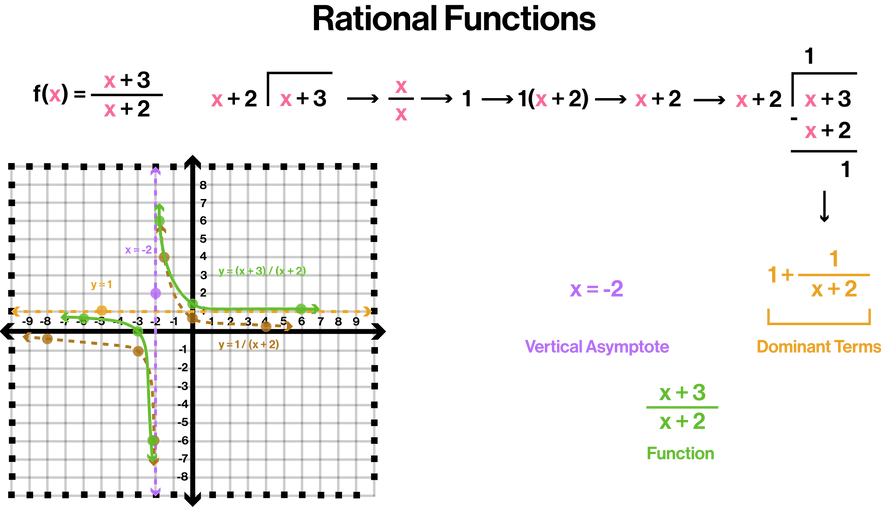
Dominant Terms: The terms that result from polynomial division. Dominant terms can be used to predict a function’s behavior.
Rational functions and their asymptotes are frequently associated with limits involving infinity. A rational function’s asymptotes can be determined using precalculus methods.

Graphs may need to be sketched based on conditions.
.png)
Limits of differences (infinity) can be found by multiplying and dividing by the conjugate.
Derivative at a Point
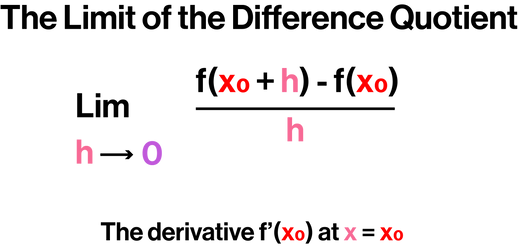
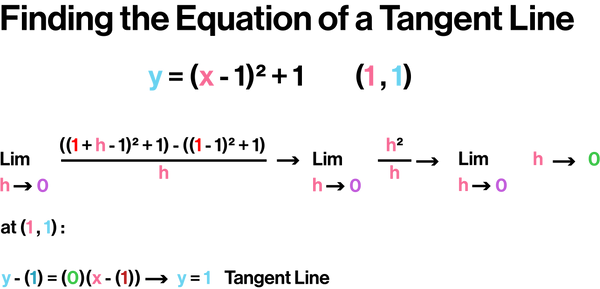


The derivative of a function at a point can be used to find both the slope and the instantaneous rate of change of a function.
Derivative as a Function
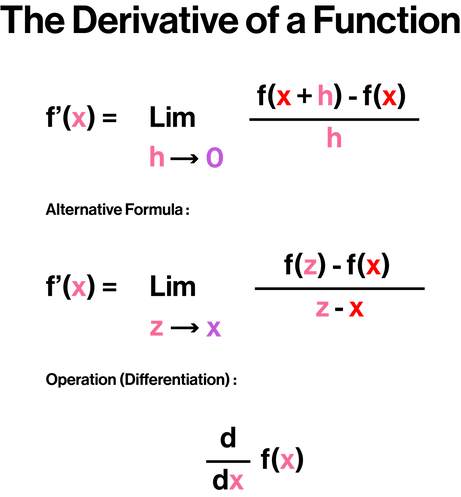


Differentiation: Calculating the derivative of a function.

.png)
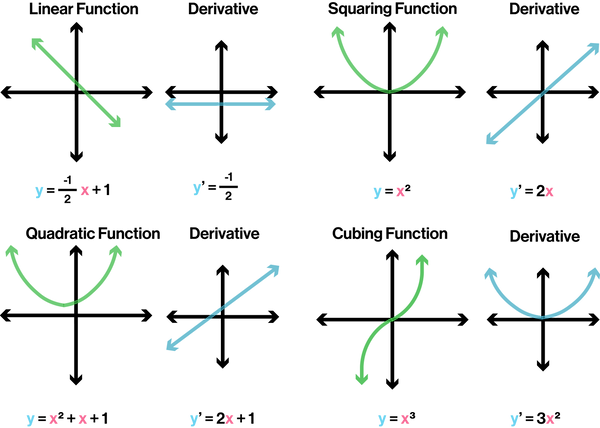
f’(x) can be graphed with certain restrictions.
It is helpful to know the graphs of the derivatives of basic functions.
Differentiation Rules

Derivative rules are necessary for certain scenarios and can be used hasten the speed of differentiation.

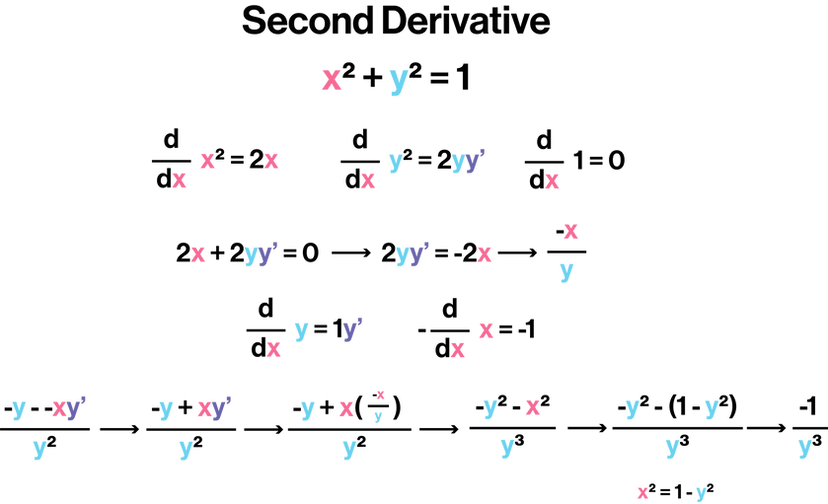
Second-Order Derivative: The derivative of the first derivative.

Higher-Order Derivatives: The nth derivative of a function.
Derivative (Rate of Change)
.png)
Instantaneous Rates: The limits of average rates.

Velocity: The derivative of position with respect to time.
Speed: The absolute value of velocity.
Acceleration: The derivative of velocity.
Jerk: The derivative of acceleration.
Derivatives of Trigonometric Functions

The derivatives of trigonometric functions can be found using the derivative chart.
Chain Rule

.png)

Chain Rule: A method of finding the derivative of a composite function.
Implicit Differentiation

Implicit Relations: Equations involving the variables x and y. Implicit relations require applying a y’ tracker to the derivative of all y terms. The terms with a y’ tracker are then separated to one side of the equation, and then the terms without y’ trackers are divided by the terms with the y’ trackers.
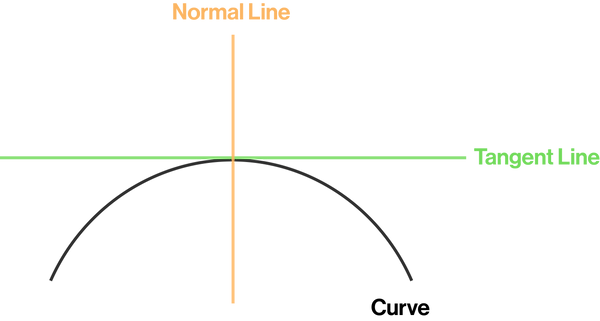
Normal Line: The line perpendicular to the tangent line.
Derivatives of Inverse and Logarithmic Functions


Special rules can be applied to find the derivative of the inverse of a function, as well as functions containing logarithms and exponents.
Derivatives of Inverse Trigonometric Functions

Special rules can be applied to find the derivative of an inverse trigonometric function.
Linearization and Differentials

Linearization: An approximation of a more complicated function.


Differentials: The variables dx and dy.
Extreme Values on Closed Intervals


Extreme Values: Maximum and minimum values.
Absolute Extreme Values: The largest value and smallest value found on an interval. A function that is continuous over a finite closed interval has both an absolute maximum and an absolute minimum value on the interval.
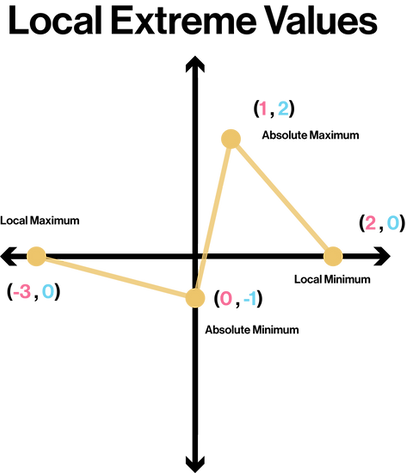
Local Extreme Values: The largest and smallest values within a segment of the interval. More than one local maximum and minimum can exist.


Critical Point: An interior point of the domain of a function f where f’ is zero or undefined.
Mean Value Theorem

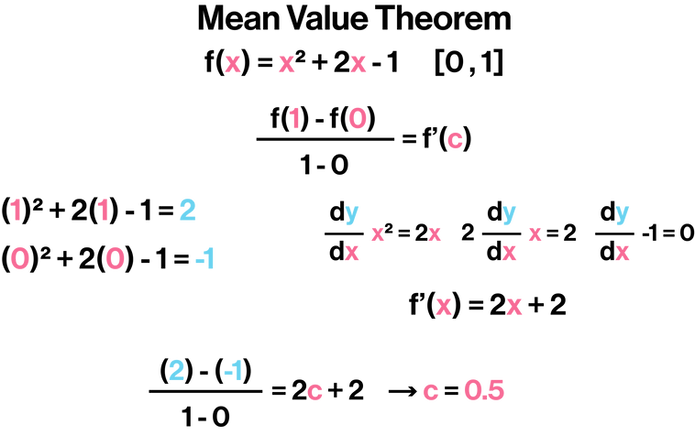
Mean Value Theorem: States that there is a point where the tangent line is parallel to the secant line that joins A and B.
f(x) must be continuous over a closed interval and differentiable on the interval’s interior.

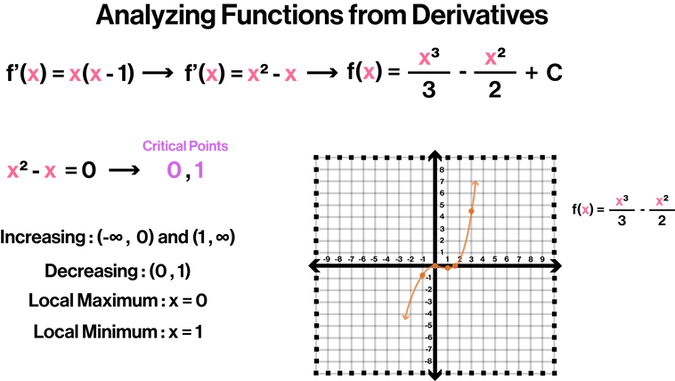
Some questions may request plotting the zero of a function and its derivative on a number line.
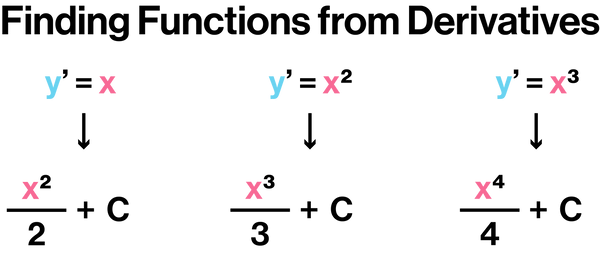
Derivatives can be used to determine their corresponding function.
Analyzing Graphs
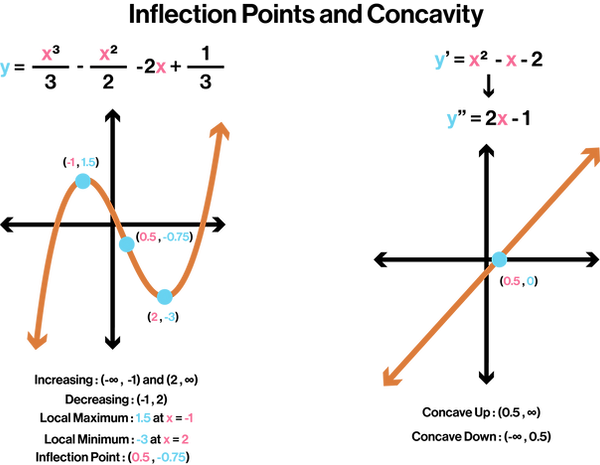
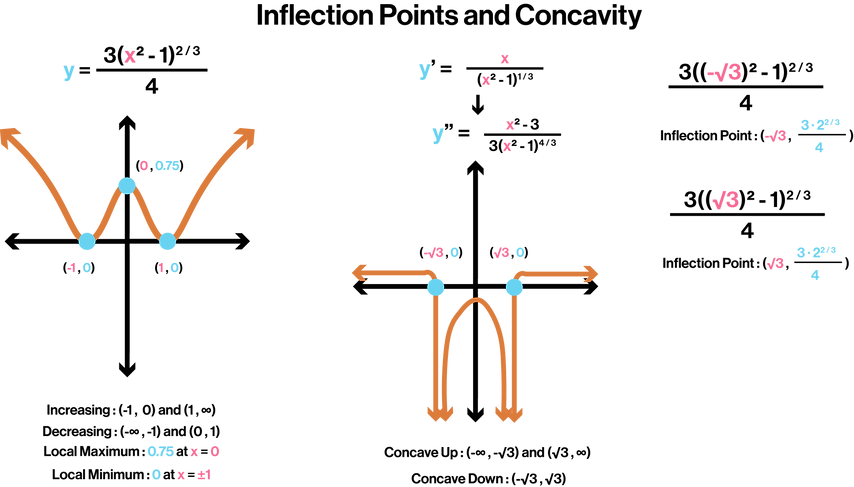
Concave Up: If f’ is increasing on the interval, or f’’ > 0 on the interval.
Concave Down: If f’ is decreasing on the interval, or f’’ < 0 on the interval.
Point of Inflection: (c ,f(c)) where either f’’(c) = 0 or f’’(c) does not exist.
L'Hôpital's Rule
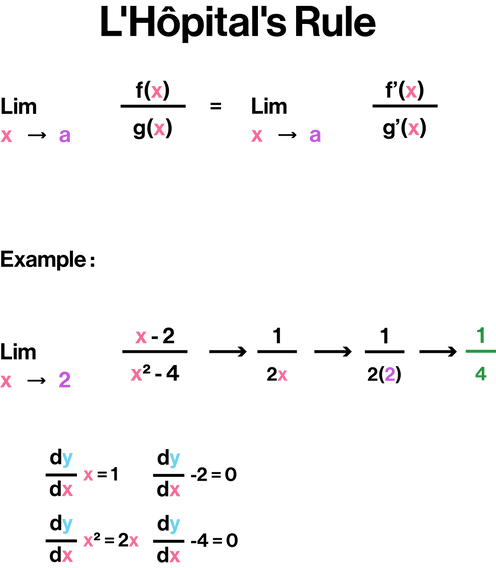
L'Hôpital's Rule: A way to calculate limits using derivatives.
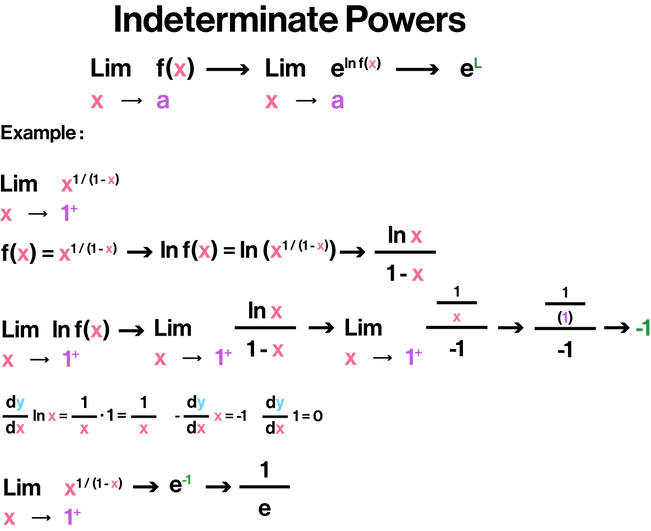
Indeterminate Form: An expression that does not have a numerical value. In some cases, limits that lead to indeterminate forms can be found by cancellation, rearrangement of terms, algebraic manipulation, or by applying the indeterminate powers rule.
Indeterminate forms 1^∞ , 0^0 , and ∞^0 can be solved by taking the logarithm of the function, using l'Hôpital's rule, then applying the indeterminate powers rule.
Antiderivatives
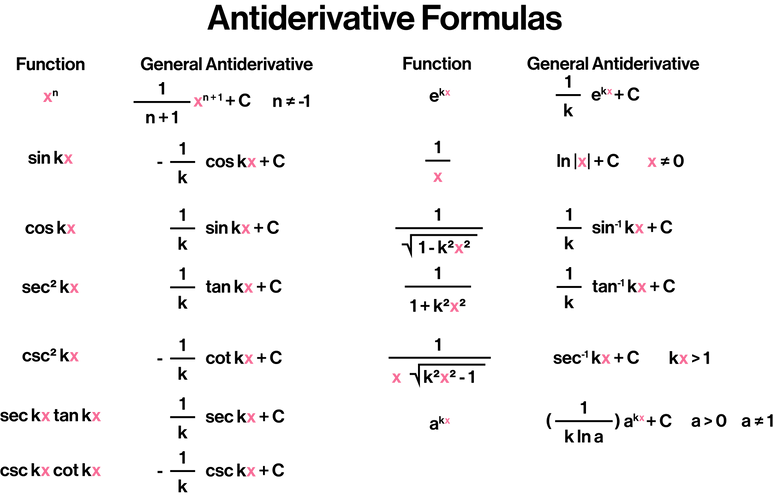
Antidifferentiation: Recovering a function from its derivative.
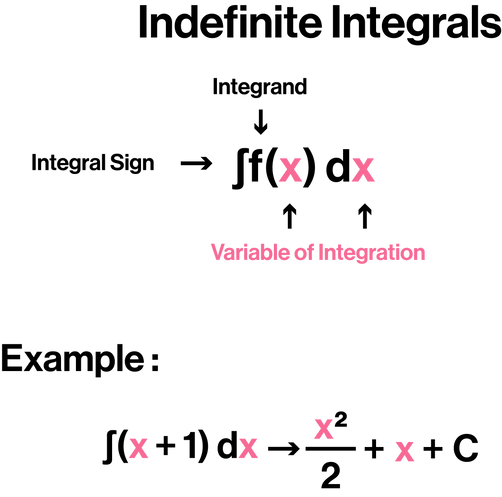
Indefinite Integral: The collection of all antiderivatives.
Integrand: The function of the integral.
Practice Sheets
bottom of page