top of page

Data
.png)
Data: Observations.

Population: All of the data being considered.
Parameter: A numerical measurement that describes a characteristic of a population.
Sample: Data from a portion of the population.
Statistic: A numerical measurement that describes a characteristic of a sample.

Qualitative Data: Data that consists of labels or names.
Quantitative Data: Data that consists of numbers that represent measurements or counts.
Discrete Data: Quantitative data in which the number of values is finite—for example, the number of dice rolls before rolling a six.
Continuous Data: Quantitative data in which the number of values is infinite—for example, lengths between 0mm and 10mm.

Nominal Level of Measurement: Data that cannot be arranged in order and consists of labels, names, or categories.
Ordinal Level of Measurement: Data that can be arranged in order, but the differences (subtraction) between data values are meaningless.
Interval Level of Measurement: Data that can be arranged in order, and the differences (subtraction) between data values are meaningful. At the interval level of measurement, there is no natural zero starting point, and ratios are meaningless.
Ratio Level of Measurement: Data that can be arranged in order, and the differences (subtraction) between data values are meaningful. At the ratio level of measurement, there is a natural zero starting point.
Sampling Methods
Random Sample: All members of a population have the same chance of being selected.
Simple Random Sample: A sample of n subjects is selected in a way that every sample of the same size has the same likelihood of being selected.
Systematic Sample: Every nth subject is selected.
Convenience Sample: Easily obtained data.
Stratified Sample: A population is divided into groups that share similar characteristics, and then members of each group are randomly selected.
Cluster Sample: A population is partitioned into groups, and then groups are randomly selected. If a group is chosen, then all members within that group are selected.
Voluntary Response Sample: Respondents decided whether they participate or not.
Descriptive Statistics
Descriptive Statistics: Methods that describe characteristics of data.

Mean: The value at the center of a set of data. The mean carries one more decimal place than the values in the original data.

Median: The middle value of a data set, where the values are arranged in order of increasing magnitude. The median carries one more decimal place than the values in the original data.

Mode: The value(s) that appear(s) most in a data set. Mode is a measure of center.

Midrange: The value that is midway between the maximum value and the minimum value in a data set. The midrange carries one more decimal place than the values in the original data.

Weighted Mean: The mean of data values that are assigned different weights. When calculating a GPA, the final answer should be rounded to two decimal places.

Harmonic Mean: A measure of center for data sets consisting of rates of change.
Root Mean Square: A measure of center commonly used in physics when dealing with data related to electricity.

Range: A measure of variation, the amount that values vary among themselves. The range carries one more decimal place than the values in the original data.


Standard Deviation: A measure of deviation from the mean. A larger standard deviation value indicates a high amount of variation in the data. Outliers greatly affect the value of the standard deviation.

Range Rule: A tool used to classify data values as either significantly low, significantly high, or not significant. The range rule is based on evidence that for many data sets, a majority of their data values lie within two standard deviations of their mean.

Empirical Rule: Standard deviation properties that apply to data sets that have a bell-shaped distribution.

Mean Absolute Deviation: The mean distance of the data from the mean.

Variance: Standard deviation squared.


Coefficient of Variation (CV): A percentage that describes the standard deviation relative to the mean. The coefficient of variation is used to compare variation between two or more data sets that don't necessarily share the same scale or units. A high percentage indicates a high amount of variation in the data. The coefficient of variation is rounded to one decimal place.


Z Score: The number of standard deviations that a value is below or above the mean. A z score that is less than or equal to -2 is significantly low, and a z score greater than or equal to 2 is significantly high. Z scores are rounded to two decimal places.


Percentiles ( P ): A measure of location that divides data into 100 groups with about 1% of the values in each group.


Quartile ( Q ): A Measure of location that divides data into 4 groups with about 25% of the values in each group. When the number of values less than (x) contains a decimal, it is rounded down. When the number of values less than (x) is a whole number, x is added to the number directly behind it, then divided by 2.

Boxplot: A graph of a data set made up of a line that extends from the maximum value to the minimum value and a box with lines drawn at Q1, Q2, and Q3.

Additional statistics are defined using percentiles and quartiles.
Frequency Distributions


Frequency Distribution: A table that partitions data into classes. Each class is displayed along with the number of data values within it.
Lower Class Limits: The smallest numbers that belong to each different class.
Upper Class Limits: The largest numbers that belong to each different class.
Class Boundaries: The numbers that are at the center of the gaps between each class. Class boundaries also exist before the smallest class and after the largest class.
Class Midpoints: The values in the middle of each class. Class midpoints are calculated by adding the lower class limit to the upper class limit and dividing by two.
Class Widths: The difference between two consecutive lower class limits. Also, the difference between two consecutive class boundaries.


Relative Frequency Distribution: Relative frequencies replace the frequencies of a frequency distribution.
Percentage Frequency Distribution: Percentages replace the frequencies of a frequency distribution.

Cumulative Frequency Distribution: The frequency for each class is the sum of the frequencies for that class and all previous classes before it.

Frequency distributions also summarize qualitative data sets.

The mean of a frequency distribution can be approximated by assuming that all sample values in each class are equal to the class midpoint.
Histograms


Histogram: A graph that consists of bars of equal width. The horizontal axis represents the class of quantitative data, and the vertical axis represents frequency.
Normal Distribution: A set of data that, when graphed as a histogram, has a bell shape.
Uniform Distribution: A histogram in which all of the bars are approximately the same height.
Skewed to the Right Distribution: A set of data that, when graphed as a histogram, has a longer right tail.
Skewed to the Left Distribution: A set of data that, when graphed as a histogram, has a longer left tail.
Probability
Probability ( P ): A measure of the likelihood of an event occurring. Either the exact decimal can be given or a probability can be rounded to three significant digits.

Event: A collection of outcomes.
Simple Event: An outcome that cannot be broken down any further.

The possible values of a probability range from zero to one. A probability of zero indicates that an event is impossible, and a probability of one indicates that an event is absolutely certain.


Relative Frequency Approximation of Probability: The probability of an event is approximated by repeating a procedure and recording the number of times the event occurs. As the procedure is repeated, the relative frequency probability of an event tends to approach the true probability.
Classical Approach to Probability: The probability of a specific event is determined by finding the number of ways the specific event occurs and determining all of the other possible simple events that may also occur. The classical approach is only applicable if each of the different simple events is equally likely to occur.
Subjective Probability: The probability of an event is estimated using personal knowledge about the topic.

The Complement of an Event: All outcomes in which a specific event does not occur.

Odds: An expression of likelihood.

Compound Event: An event that combines two or more simple events.
Probability Addition Rule: Used to find the probability of event A or B or both occurring as the single outcome of a procedure.

An event added to its complement always equals one.

Probability Multiplication Rule: Used for finding the probability that events A and B both occur. Unlike the addition rule, events A and B occur in different trials.
Independent Events: The occurrence of one event does not affect the probability of the other event.
Dependent Events: The occurrence of one event affects the probability of the other event. For large calculations, dependent events can be treated as independent events to help reduce the difficulty of the calculations.

The complement of an event that uses the term "at least one" will have none of that event occurring.

The probability of an event that uses the term "at least one" can be found by determining the probability of the event's complement.

Conditional Probability: The probability of an event is calculated based on information that a different event has already occurred.

Bayes' Theorem: A theorem that can be used to calculate the conditional probability of an event.
Counting
Counting: Finding the total number of simple events for a given situation.

Multiplication Counting Rule: Used to calculate the total number of possibilities for a sequence of events.

Factorial Rule: Used to find the number of ways that items in a set can be rearranged. Order matters when using the factorial rule.
.png)
.png)
Permutations: Arrangements in which different sequences of the same items are counted separately.

Combinations: Arrangements in which different sequences of the same items are counted as being the same.
Discrete Probability Distributions

Random Variable: A variable that has a single value, determined by chance, for each outcome of a given procedure. Random variables can be discrete, with a countable number of values, or continuous, with an infinite number of values.
Probability Distribution: A graph, formula, description, or table that gives the probability for each value of the random variable.

Probability distributions have special formulas used to calculate a distribution's mean, standard deviation, and variance. Results should carry one more decimal place than the number of decimal places used for the random variable.
.png)
The range rule can also be used to determine if the value of a random variable is significantly high or low.

Expected Value (E): E = μ.

Binomial Probability Distributions: The requirements for a binomial probability distribution are that there are only two outcomes, there is a fixed number of independent trials, and the probability of "success" remains constant throughout all trials. The two outcomes of a binomial probability distribution are typically classified as success and failure.

The probability of "x" successes among "n" trials can be calculated using the binomial probability formula.

Binomial distributions have special formulas used to calculate a distribution's mean, standard deviation, and variance.


Poisson Probability Distribution: A probability distribution that applies to occurrences of an event over a specific interval, such as time or distance. The requirements for a Poisson Probability Distribution are that the occurrences must be random, independent, and uniformly distributed over the interval.
Continuous Probability Distributions
Density Curve: The graph of any continuous probability distribution. The total area under any density curve is equal to 1. The shaded area under a density curve represents the probability that an event will occur.
.png)
Uniform Probability Distributions: Distributions where the random variable's values are equally distributed over the range of possible values. The area of a portion of a uniform probability distribution can be found by using the area formula for a rectangle.


Standard Normal Probability Distributions: Distributions with a bell-shaped curve, a mean of zero, and a standard deviation of one. A z score table can be used to find the area under a normal distribution or its corresponding z score value.

Nonstandard normal distributions can be converted into standard normal distributions by utilizing the z score formula.

Critical Values: z scores that border significantly high or low z scores.
Estimators


Proportion (p̂): The ratio of the number of successes to the sample or population size.
Unbiased Estimators: Statistics that target the value of their corresponding population parameter. Unbiased estimators include proportion, mean, and variance.
Biased Estimators: Statistics that do not target the value of their corresponding population parameter. Biased estimators include median, range, and standard deviation.
Sample Mean Distribution: When samples of the same size are taken from the same population, the sample means tend to be normally distributed. The mean of the sample means equals the population mean.
Sample Proportion Distribution: When samples of the same size are taken from the same population, the sample proportions tend to be normally distributed. The mean of the sample proportions equals the population proportion.
Sample Variance Distribution: When samples of the same size are taken from the same population, the distribution of sample variances tends to be skewed to the right. The mean of the sample variances equals the population variance.

The probability of a sample mean that is normally distributed can be found using these equations.
Central Limit Theorem: For all samples of the same size n, where n > 30, the sampling distribution of the sample mean can be estimated by a normal distribution with mean (μ) and standard deviation (σ / √n).
Estimating The Population Proportion
Point Estimate: A single value used to estimate a population parameter.
The best point estimate of the population proportion (p) is the sample proportion (p̂).

Confidence Level: The probability that the confidence interval contains the population parameter.


Margin of Error: The amount by which the sample statistic misses its corresponding population parameter.


Confidence Interval: A range of values used to estimate the true value of a population parameter. The confidence interval limits for (p) should be rounded to three significant figures.

Sample Size: The number of units that have to be collected to estimate some population parameter. The required sample size should always be rounded up to the nearest whole number.
Estimating The Population Mean
The best point estimate of the population mean (μ) is the sample mean (X̄).


Student t Distribution: A distribution with a bell shape similar to a normal distribution; however, a t distribution has more variability than a normal distribution. A t distribution has a standard deviation that is greater than one and a mean of 0. As the sample size increases, the t distribution becomes more similar to a normal distribution.


The formulas used to determine a confidence interval for a population mean depend on the information provided. If a question includes information that doesn't fit any of the previously listed conditions, technology is required.

The required sample size should always be rounded up to the nearest whole number.
Estimating The Population Standard Deviation and Variance
The best point estimate of the population variance (σ^2) is the sample variance (s^2). The sample standard deviation (s) is commonly used as a point estimate of the population standard deviation (σ), even though it is a biased estimator.


Chi-square Distribution: The values of a chi-square distribution cannot be negative. The distribution approaches a normal distribution as the number of degrees of freedom increases.

For chi-square distributions, there are two critical values, left and right, associated with a given confidence level.

If the original data set is available, the confidence interval limits should be rounded to one more decimal place than the values in the original data set. If the original data set is not available, the confidence interval should be rounded to contain the same number of decimal places as the standard deviation (s).
Hypothesis Testing
Hypothesis: A claim about a property of a population.

Null Hypothesis (H0): A statement that the value of a population parameter is equal to a claimed value.
Alternate Hypothesis (H1): A statement that the value of a population parameter differs from the null hypothesis. The alternate hypothesis uses one of these symbols: < , > , ≠.

Significance Level α: The probability of wrongly rejecting the null hypothesis when it is true.

Test Statistics: A value used to judge the null hypothesis. Test statistics are found by converting a sample statistic to a score.


The P-value Method and the Critical Value Method are two methods used to test a hypothesis.


Critical Region: The area corresponding to all values of the test statistic that cause one to reject the null hypothesis.
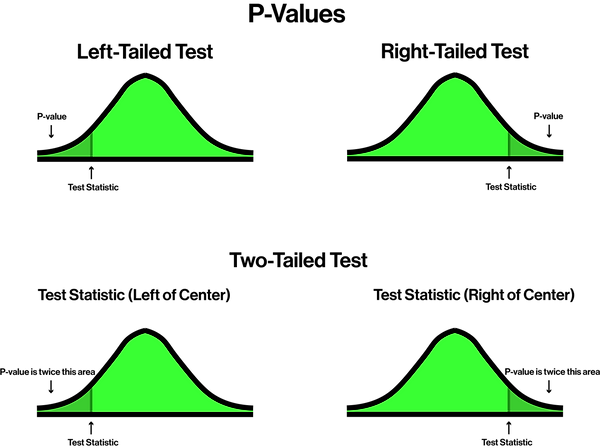

P-Value: The probability of receiving a test statistic at least as extreme as the one found from the sample data.

Two different types of errors can occur when deciding to reject or accept a null hypothesis.


Hypothesis Testing (Two Samples)


The P-value Method and Critical Value Method can be used to test a claim about two proportions.

A confidence interval can be used to estimate the difference between two population proportions (p1 - p2). If the interval does not contain zero, there is evidence that p1 and p2 differ, and the null hypothesis should be rejected.
.png)
.png)
.png)
The P-value Method and Critical Value Method can be used to test a claim about two means.

A confidence interval can be used to estimate the difference between two population means (μ1 - μ2). If the interval does not contain zero, there is evidence that μ1 and μ2 differ, and the null hypothesis should be rejected.

If the population standard deviations are known, alternative equations should be used.


Matched Pairs: An experiment for which data pairs are matched according to some relationship.
The P-value Method and Critical Value Method can be used to test if there is a significant difference between matched pairs.

A confidence interval can be used to estimate μd. If the interval contains zero, it is possible that the mean of the differences is zero, indicating no significant difference between matched pairs.
Scatterplots


Scatterplot: A plot of paired data (x , y) with a horizontal axis and a vertical axis.
x : The independent variable.
y : The dependent variable.
Correlation: When a relationship exists between the x variable and the y variable. Correlation does not imply causality.
Linear Correlation: A correlation in which the relationship between the x and y variables can be approximated by a straight line.
Linear Correlation Coefficient ( r ): The strength of the linear relationship between the x and y variables. r values range from -1 to 1.


Regression Line: The straight line that best fits the scatterplot.
Coefficient of Determination (R^2): The correlation coefficient squared. Values range from 0 to 1.


Correlation can be checked using a critical values table for the correlation coefficient r.

Residuals: The vertical distances between the original data points and the regression line.
Least-Squares Property: Applies to the regression line used for a given scatterplot. A line satisfies the least-squares property if the sum of the squares of the residuals is the smallest sum possible.


Influential Point: A point that strongly affects the regression line.
Outlier: A point that is far away from the other points.
bottom of page